The Sensitivity Parameters dialog displays a chronicle of the most recent sensitivity analysis setup. For each run, the list displays the value for each included variable, and the date and time of the most recent run.
To open this window, click on the ![]() for a graph or table that's been defined as a comparative graph or table prior to running sensitivity.
for a graph or table that's been defined as a comparative graph or table prior to running sensitivity.
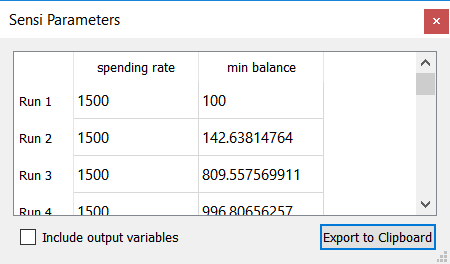
Check Include output variables to also see the output that appears on the graph or table. This will be displayed at the time for the model slider (the same value that would show in a numeric display). For scatter plots there may be two additional values shown and for bubble charts three. If the output is already an input it will not be shown twice.
Export to Clipboard will put the contents of this table into the clipboard in tab delimited format.
Note The ![]() icon appears just after a sensitivity run. If you make another run, or close and reopen the model, it will not appear.
icon appears just after a sensitivity run. If you make another run, or close and reopen the model, it will not appear.